Data Visualizations
Data Visualizations
Graduate work, Data Visualizations (MS), Parsons
2016
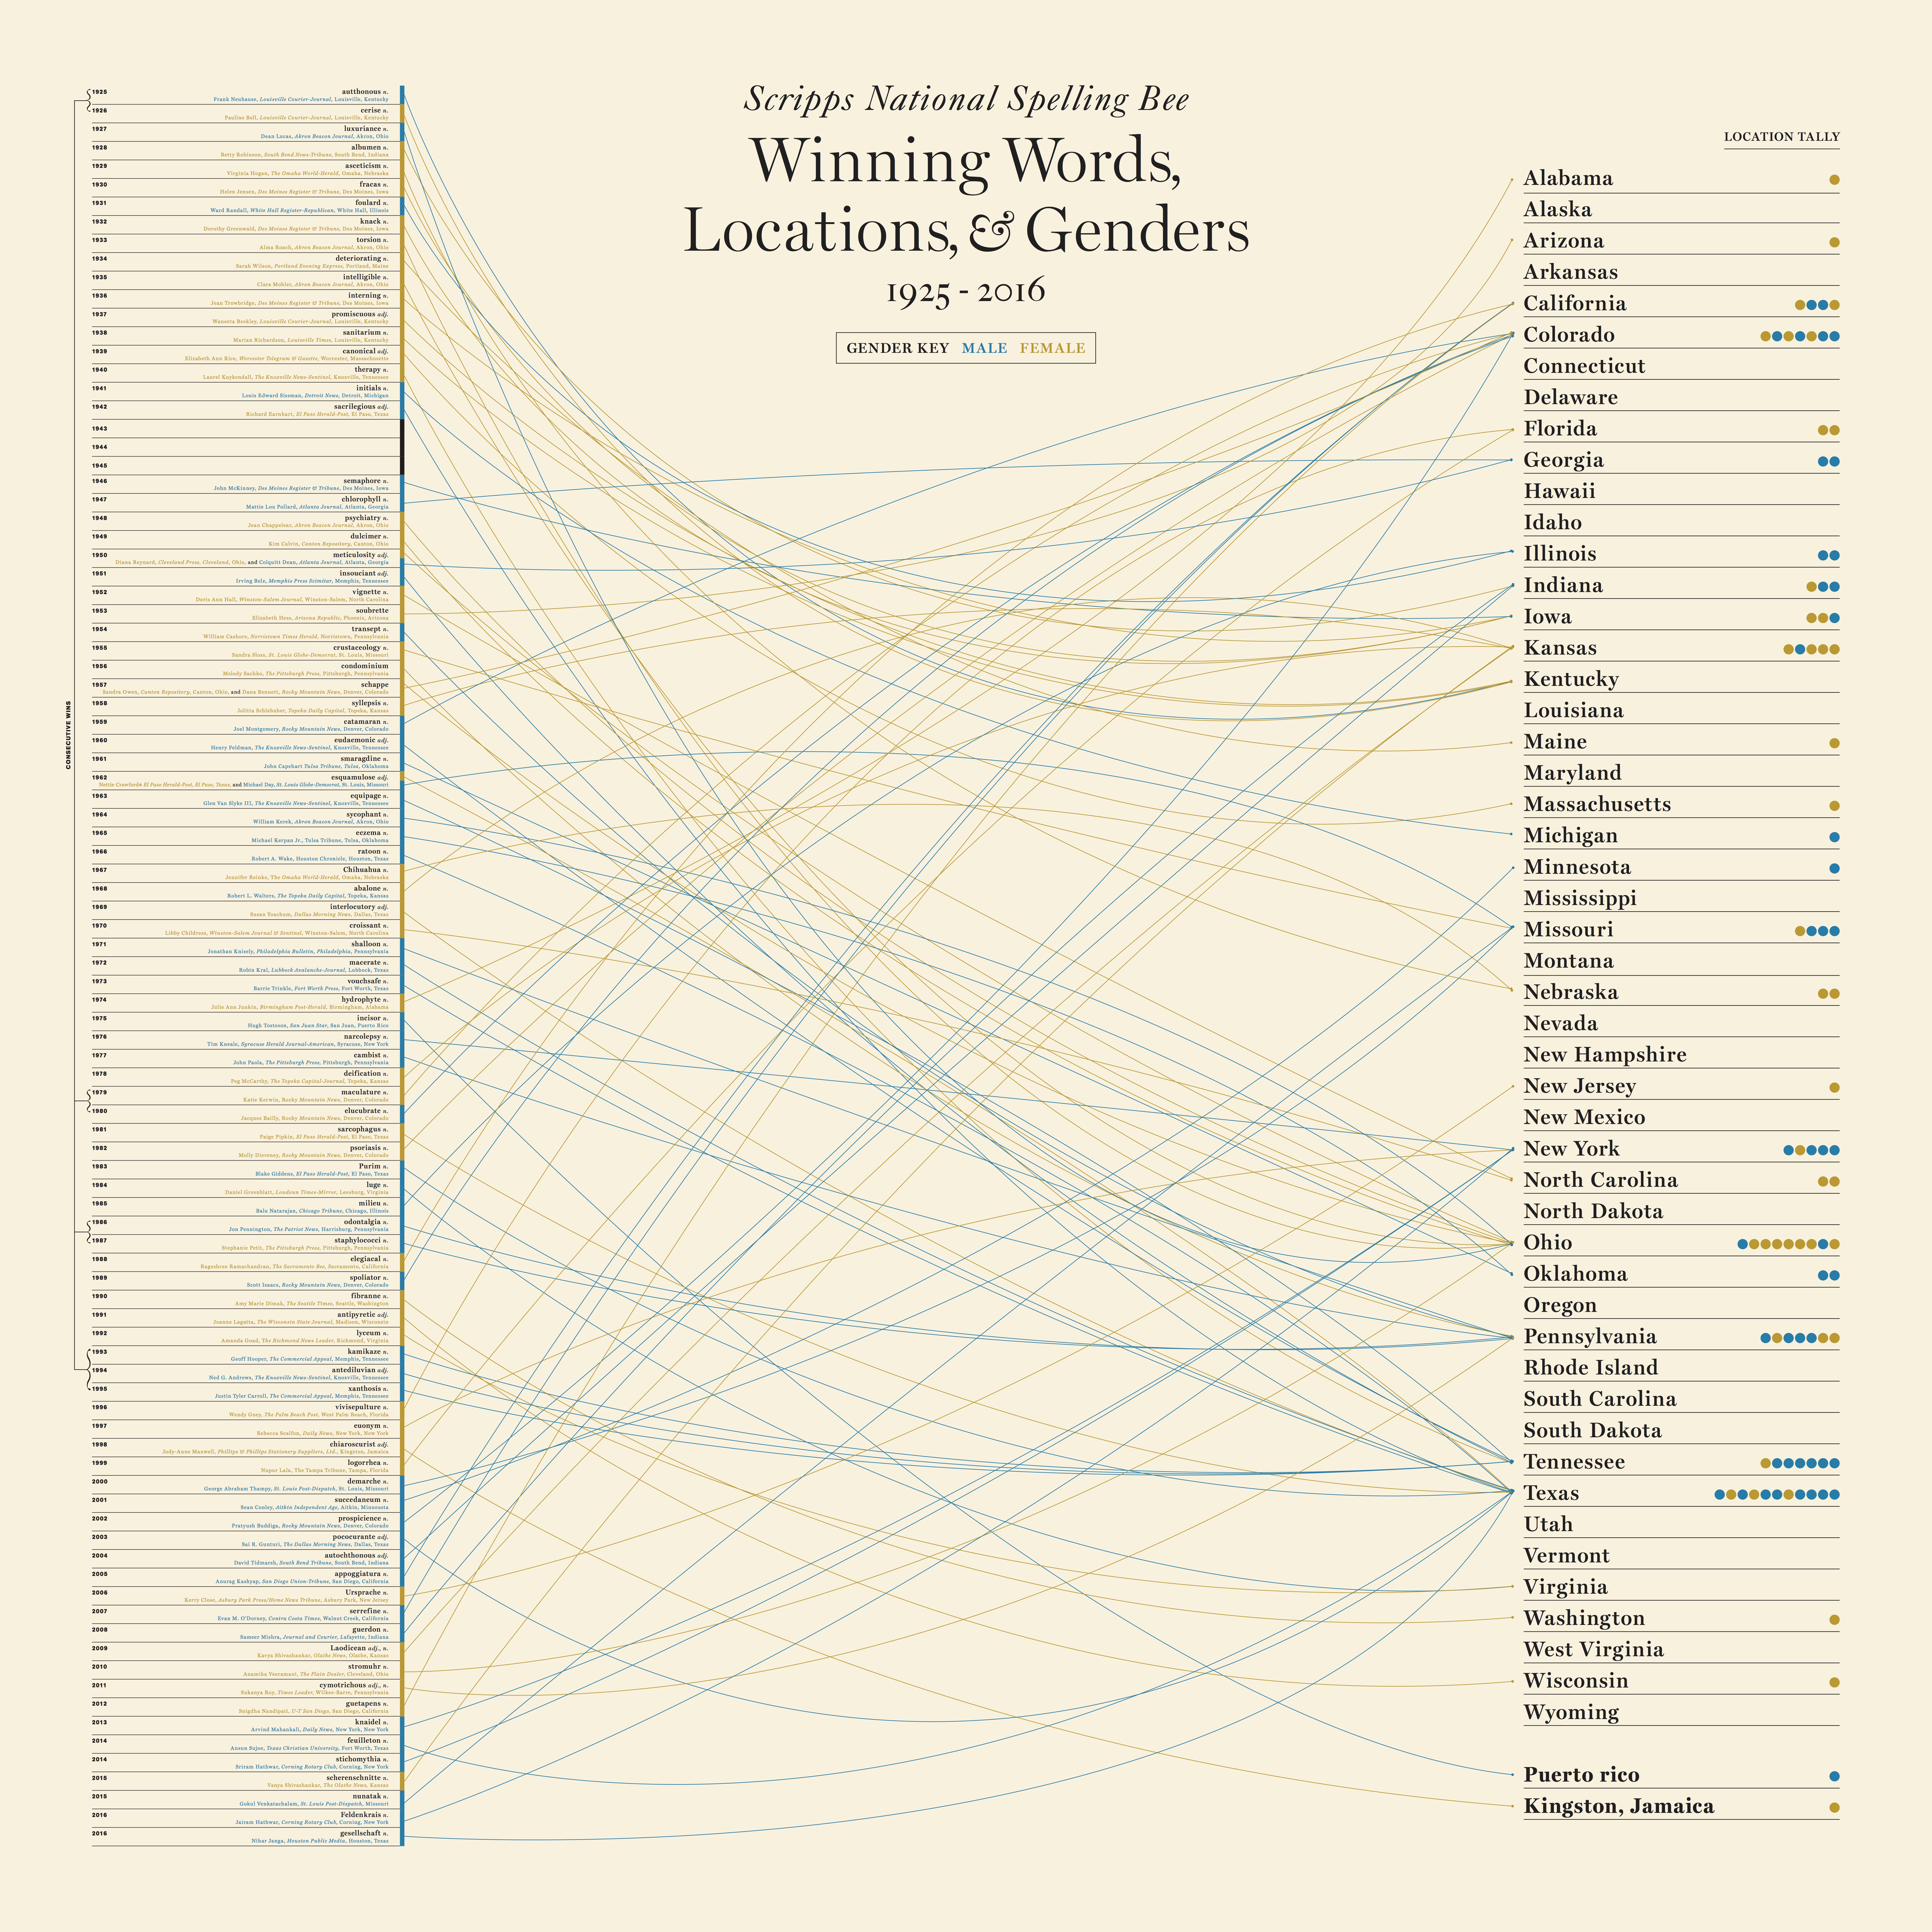
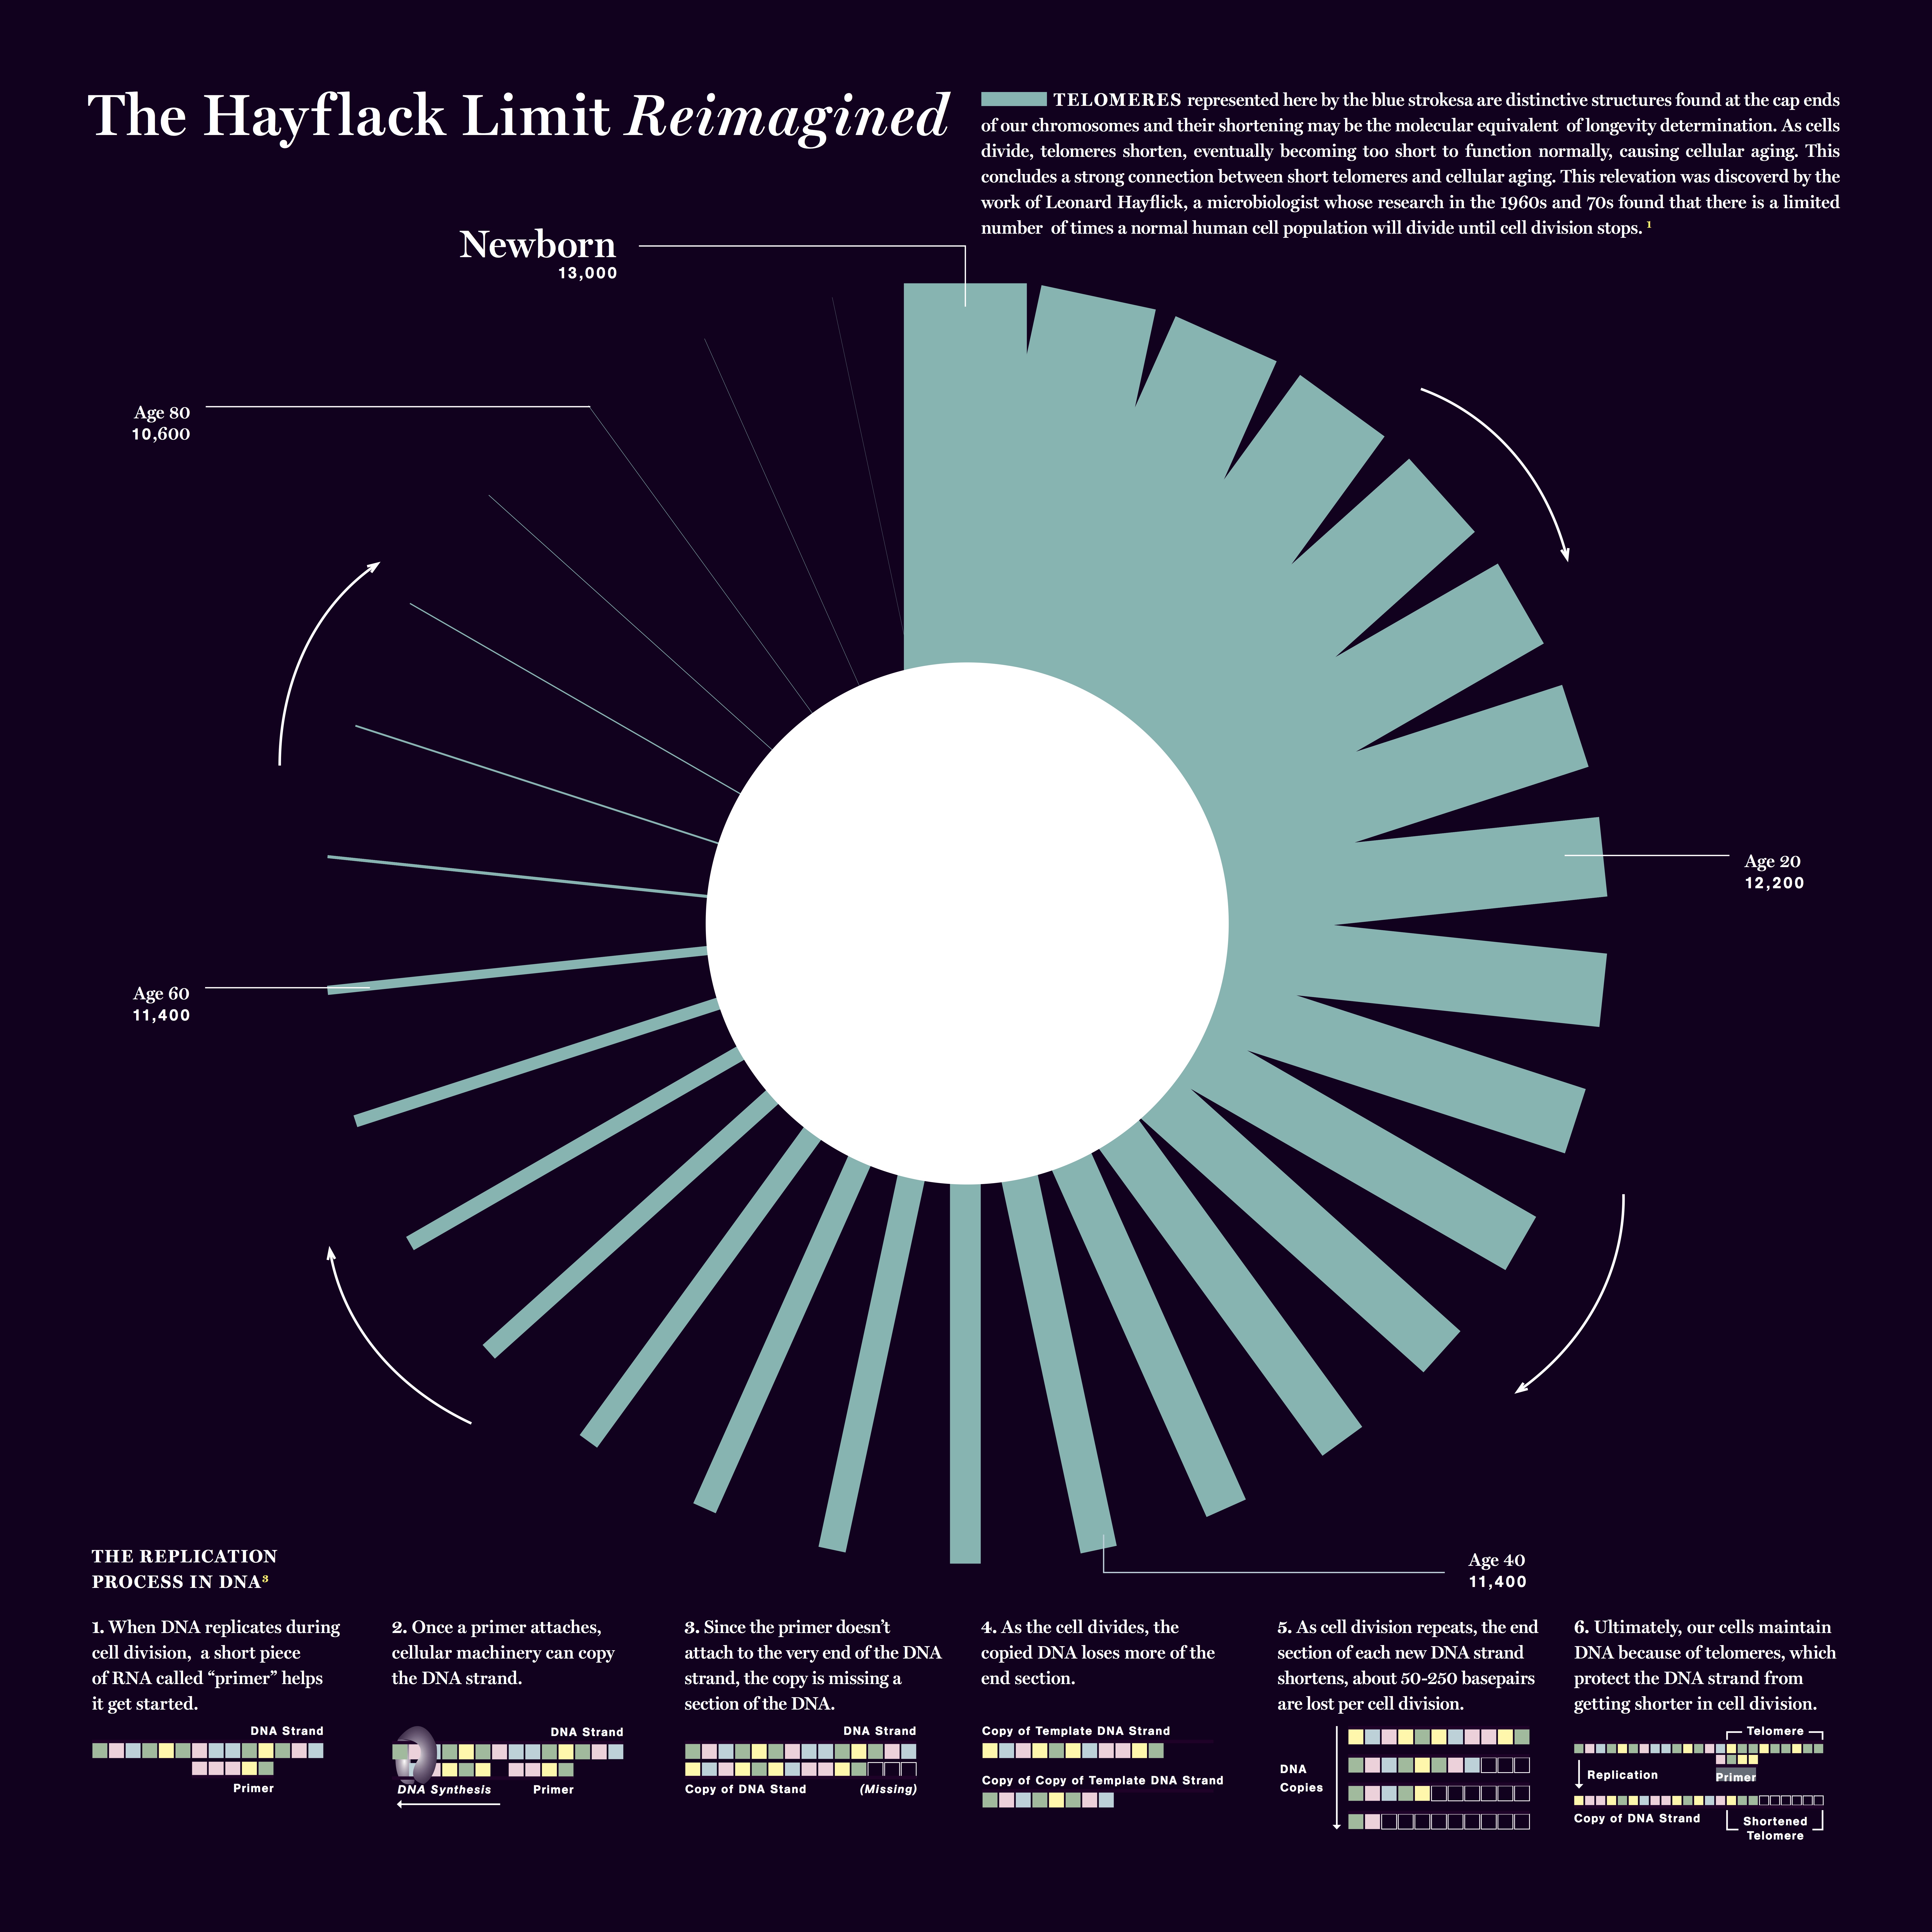
A series of infographic posters (52in x 52 in ) from the course: Data Visualization and Information Aesthetics. Explored, analyzed and designed visualizations on a wide range of topics ranging from my favorite running shoes to aging process of telomeres.
2016
A series of infographic posters (52in x 52 in ) from the course: Data Visualization and Information Aesthetics. Explored, analyzed and designed visualizations on a wide range of topics ranging from my favorite running shoes to aging process of telomeres.


