Asia Society
Asia Society
Data Visualization
2020
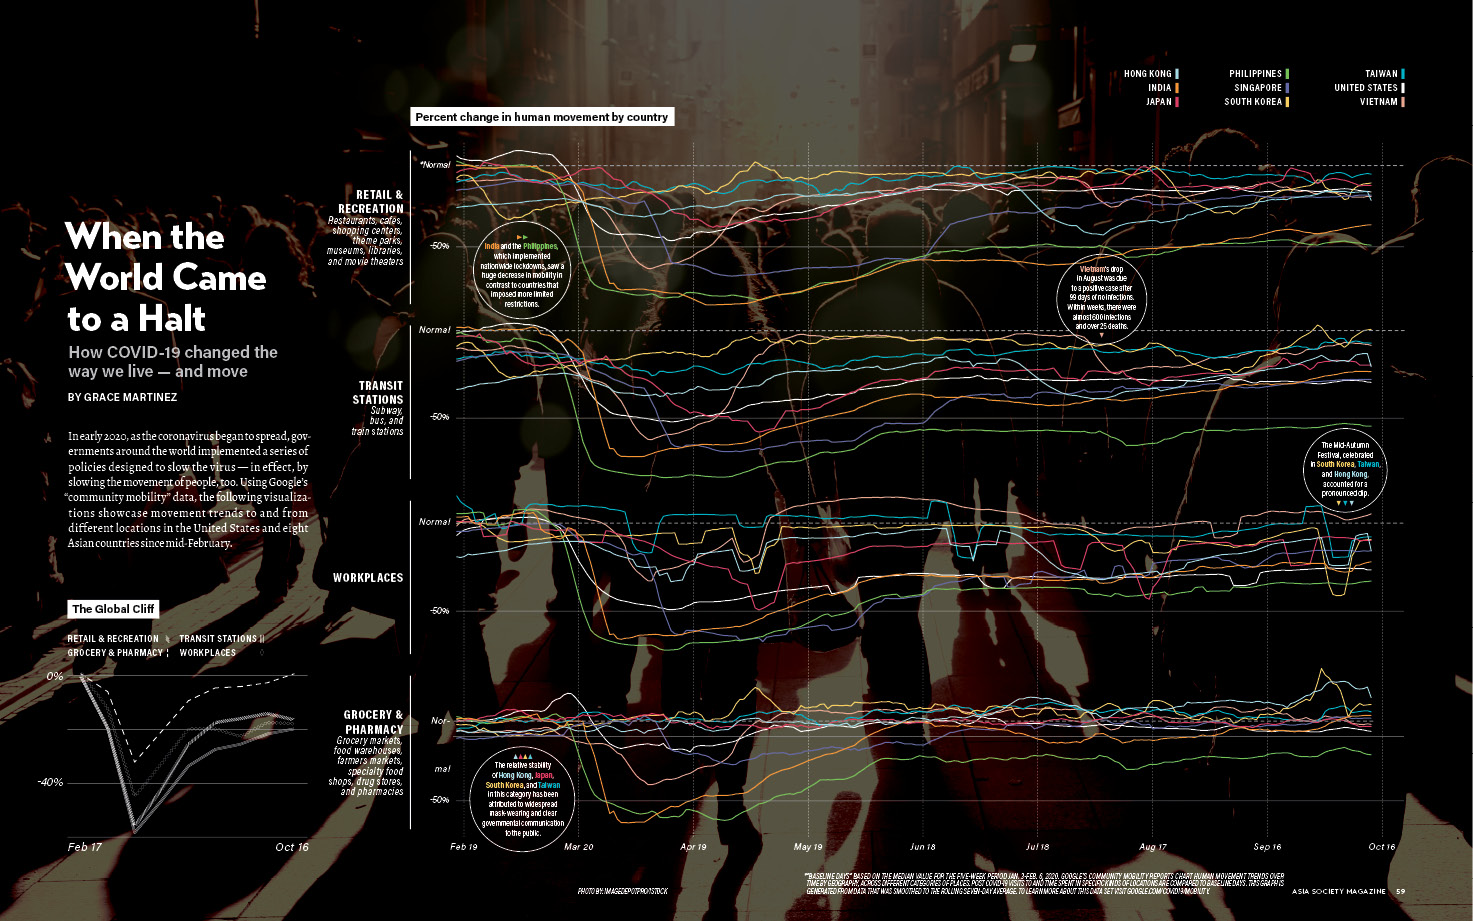
The goal for this visualization was to provide comparative insight into how mobility within countries around the world (with highlighted focus on Asia) have been disrupted since Covid 19. This was done by displaying how the number of visitors to places of retail, recreation, public transport stations, and workplaces has changed relative to the period before the pandemic around the world.
Data Source: https://www.google.com/covid19/mobility/
Design Director Lisa Lok
![]()
2020
The goal for this visualization was to provide comparative insight into how mobility within countries around the world (with highlighted focus on Asia) have been disrupted since Covid 19. This was done by displaying how the number of visitors to places of retail, recreation, public transport stations, and workplaces has changed relative to the period before the pandemic around the world.
Data Source: https://www.google.com/covid19/mobility/
Design Director Lisa Lok